R3 Draw - Curve Related Commands
| Contents | ||
See also:
- R3 View - Graphics Draw Dialect
- R3 Draw - Setup and Attribute Commands
- R3 Draw - Line Related Commands
- R3 Draw - Shape Sub-Commands
Concept
This section describes draw commands that are related to curves and ellipses.
All of these are part of the draw dialect, a REBOL sub-language for describing scalar vector graphics (SVG). The dialect consists of a number of command keywords, as listed in this document below.
Each command can be followed by its arguments, all of which are optional. Their names, datatypes, and descriptions are provided in the "argument" table for each command section below.
Arc
The ARC command draws a partial section of an ellipse or circle.
| Argument | Datatype | Description |
|---|---|---|
| center | pair! | The center of the circle |
| radius | pair! | The radius of the circle |
| angle-begin | decimal! | The angle where the arc begins, in degrees |
| angle-length | decimal! | The length of the arc in degrees |
| closed | word! | Optional, must be the word closed closed - close the arc |
For angle-begin 0 degrees is to right of the center point, on the horizontal axis.
Arcs are drawn in a clockwise direction from the angle-begin point.
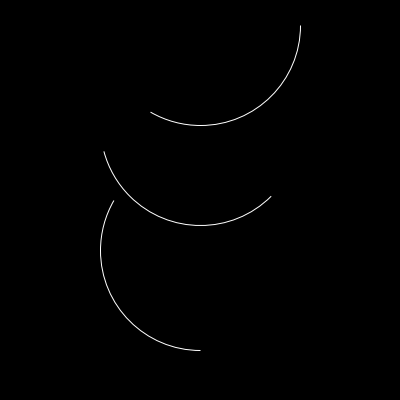
Simple open arcs beginning at 0 degrees.
arc 200x25  100x100 0  90
arc 200x125 100x100 0 135
arc 200x250 100x100 0 180
arc example 1
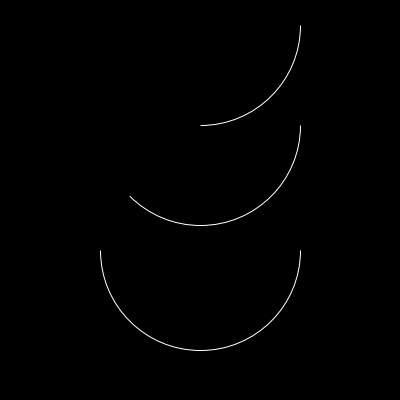
Simple open arcs beginning at different angles, but all with the same length.
arc 200x25  100x100 0  120
arc 200x125 100x100 45 120
arc 200x250 100x100 90 120
arc example 2
A closed arc. The arcs is closed by drawing lines to the center point of the circle that defines the arc.
arc 100x100 100x100 0 90 closed
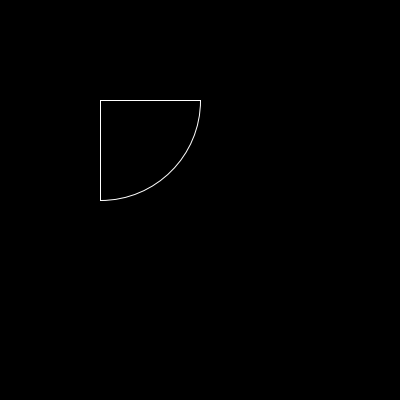
arc example 3
fill-pen red
arc 100x100 90x90 135 180
fill-pen green
arc 300x100 90x90 225 180
fill-pen blue
arc 100x300 90x90 45  180
fill-pen yellow
arc 300x300 90x90 315 180
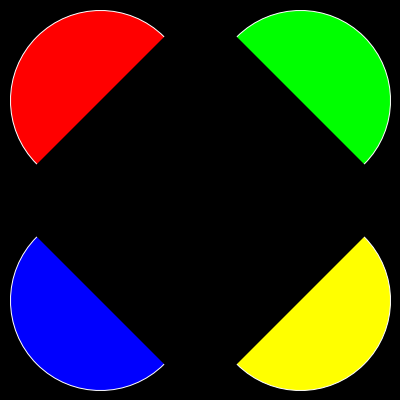
arc example 4
fill-pen red
arc 150x250 90x90 0   180
fill-pen green
arc 150x150 90x90 90  180
fill-pen blue
arc 250x150 90x90 180 180
fill-pen yellow
arc 250x250 90x90 270 180
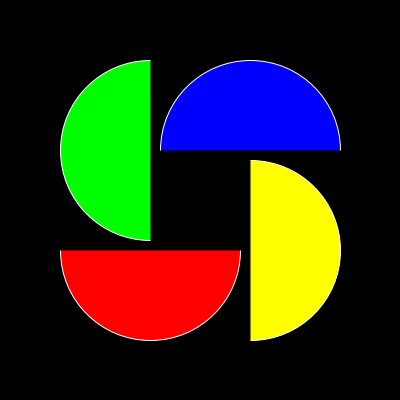
arc example 5
Closed arcs are an easy way to draw wedges for pie charts.
fill-pen red
arc 200x200 90x90 0   90 closed
fill-pen green
arc 200x200 90x90 90  90 closed
fill-pen blue
arc 200x200 90x90 180 90 closed
fill-pen yellow
arc 200x200 90x90 270 90 closed
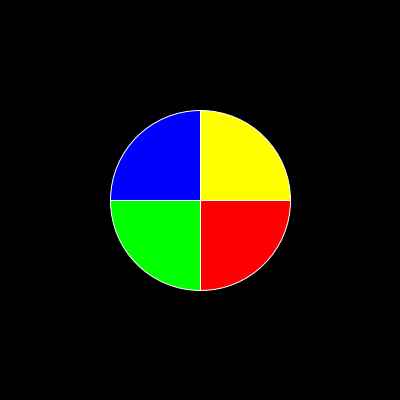
arc example 6
By changing the center point, you can draw exploded pie charts.
pen white line-width 2
fill-pen red
arc 204x204 150x150   0  90 closed
fill-pen green
arc 196x204 150x150  90  30 closed
fill-pen blue
arc 180x190 150x150 120 150 closed
fill-pen yellow
arc 204x196 150x150 270  90 closed
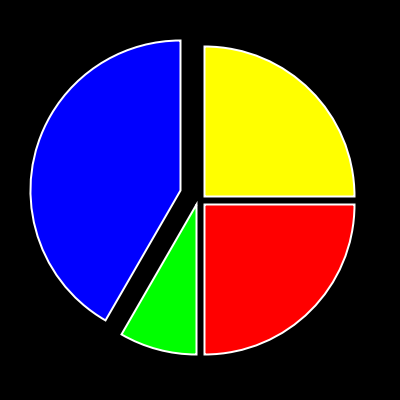
arc example 7
Circle
Draws a circle or ellipse.
| Argument | Datatype | Description |
|---|---|---|
| center | Pair! | |
| radius-x | decimal! | Used for both X and Y radii if radius-y isn't provided |
| radius-y | decimal! | Optional. Used to create an ellipse |
A simple circle
pen yellow
line-width 5
circle 200x200 150
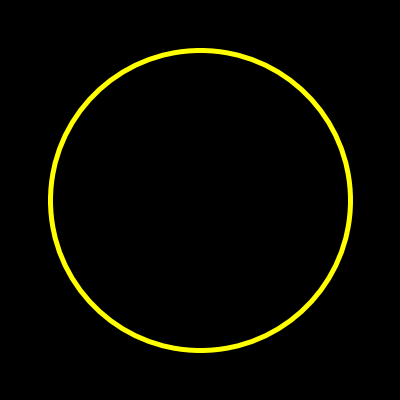
circle example 1
A circle using an image as the pen
pen logo.gif
circle 200x200 150

circle example 2
A circle using an image as the fill-pen
line-width 2
pen yellow
fill-pen logo.gif
circle 200x200 150
circle example 3
Curve
Draws a smooth Bézier curve to fit the points provided.
| Argument | Datatype | Description |
|---|---|---|
| point1 | pair! | End point A |
| point2 | pair! | Control point A |
| point3 | pair! | End point B, or control point B |
| point4 | pair! | End point B |
Either three or four points should be specified. With three points, it is a cubic Bézier curve with two endpoints and one control point. With four points it allows two control points, and it can create more complicated curves such as circular and elliptical arcs.
A curve with one control point
curve 20x150 60x250 200x50
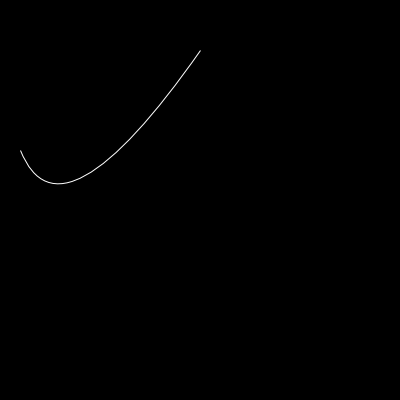
curve example 1
A curve with two control points
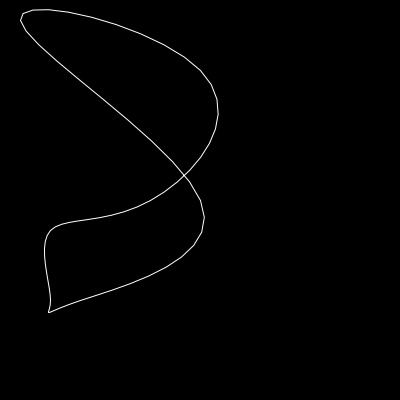
curve 20x20 80x300 140x20 200x300
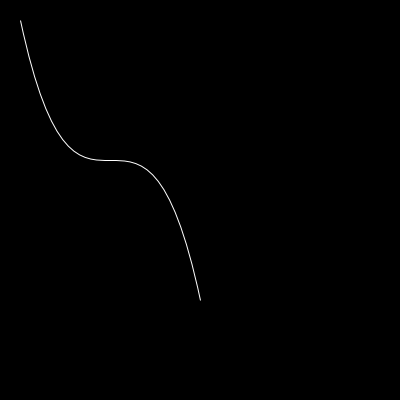
curve example 2
A thick curve with a patterened line
pen yellow
line-pattern red 5 5
line-width 4
curve 20x150 60x250 200x50
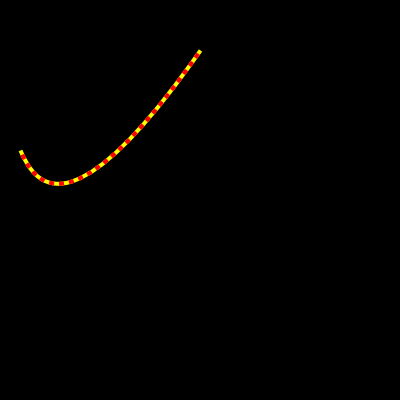
curve example 3
A thick curve with two control points, a patterened line, and a fill pen.
pen yellow
line-pattern red 5 5
line-width 4
fill-pen blue
curve 20x20 80x300 140x20 200x300
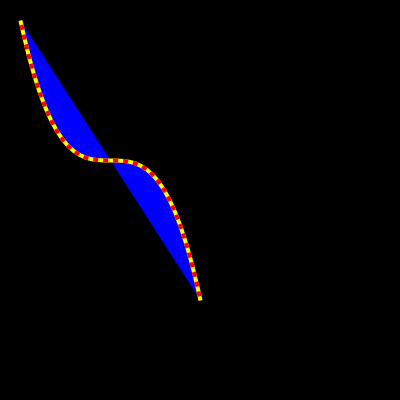
curve example 4
Ellipse
Draws an ellipse
| Argument | Datatype | Description |
|---|---|---|
| upper-left-point | pair! | The upper-left-point of the ellipse bounding box |
| diameter | pair! | X and Y diameter is specified by a pair! which is different than the CIRCLE command |
Three overlapping ellipses
fill-pen red
ellipse 50x25 100x200
fill-pen white
ellipse 100x100 200x200
fill-pen blue
ellipse 175x250 200x100
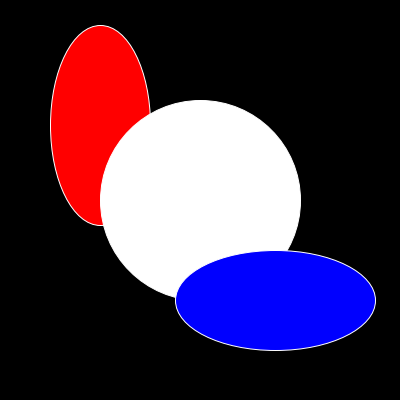
ellipse example 1
Spline
The spline command lets you draw a curve through any number of points. The smoothness of the curve will be determined by the segment factor that you specify.
| Argument | Datatype | Description |
|---|---|---|
| segmentation | integer! | Optional. Number of segments between each point; default is 1. |
| closed | word! | Optional. 'closed will cause the path to be closed between the start and end points. |
| point1 | pair! | |
| point2 | pair! | |
| ... | pair! | none |
spline 20x20 200x70 150x200 50x230 50x300 80x300 200x200
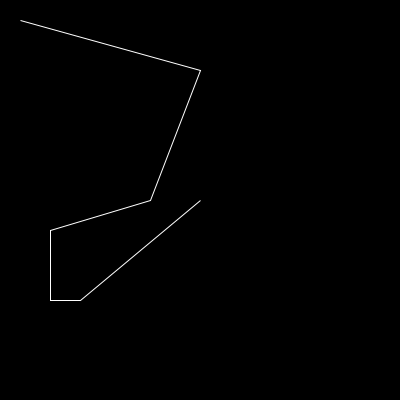
spline example 1
spline 3 20x20 200x70 150x200 50x230 50x300 80x300 200x200
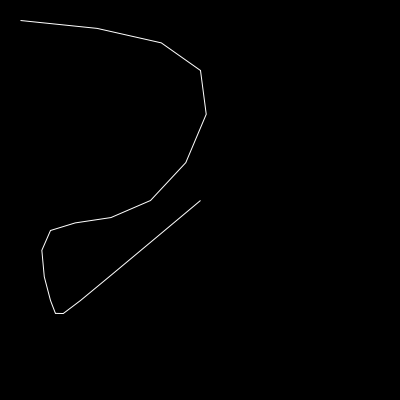
spline example 2
spline 10 20x20 200x70 150x200 50x230 50x300 80x300 200x200

spline example 3
spline 10 closed 20x20 200x70 150x200 50x230 50x300 80x300 200x200
spline example 4