REBOL 2: View Draw Dialect
Describes the original draw dialect - for historic reference. The dialect has been improved over the years, including the new anti-aliased rendering, but this document is still fairly accurate for REBOL 2.
See also R3 View - Graphics Draw Dialect for an updated R3 description.
Contents
Basics
Command Summary
Color Summary
Drawing Lines
Drawing Polygons
Drawing Rectangles
Drawing Circles
Pen Attributes
Pen
Fill-Pen
Line-Pattern
Flood Filling
Including Images
Drawing Text
Combined Effects
World's Smallest Draw Program
Known Problems
Cycling Colored Boxes
Purpose
The REBOL/View graphics system was designed for displaying user interfaces and presentations on computers, kiosks, and television sets. The system was optimized for combining multiple graphical elements such as images, text, buttons, area, and effects. Although it was not intended for low level graphics, such as rendering bitmaps, lines, or polygons, it is capable of drawing basic shapes with a variety of attributes.
Basics
In REBOL, all graphics are controlled with the FACE object. The FACE object includes many attribute fields that specify the look and feel of a graphical object. Among these is the EFFECT field that controls the processing of special effects that are applied to the face. One of these effects is DRAW, and it can render a variety of graphical shapes within the FACE object display area.
The DRAW effect uses a simple language that consists of command words and attribute values within a normal REBOL block. This "sub-language" is a dialect of REBOL. It uses standard REBOL symbols and values arranged in the order that they are to be processed.
You create the DRAW effect block then pass it to REBOL to be processed and produce the required graphical output. This dialect method is very flexible and can be used to produce an unlimited variety of graphical results. (Also, keep in mind that the DRAW effect is just one of many face effects, and it can be used alone or in combination with other effects. More later.)
The general format of the DRAW effect block is:
draw [
    word value value
    word value ...
    ...
]
The words are predefined keywords such as LINE, CIRCLE, PEN, POLYGON, and others. The values are attributes such as color or position.
The code below provides an example that displays a window that contains a black box face with a yellow line drawn diagonally within it.
view layout [
    box black 100x100 effect [
        draw [
            pen yellow
            line 20x20 80x80
        ]
    ]
]
The result looks like this:
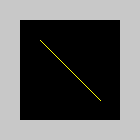
The yellow line is drawn starting from the XY position of 20x20 to the position of 80x80. These XY positions are relative to the upper left corner of the face (the black box in this case).
The words and values of the DRAW block are interpreted by the DRAW effect processor to produce the above results. The words PEN and LINE are keywords within the DRAW dialect. The word YELLOW is just a normal REBOL variable that contains the RGB color yellow. The DRAW processor automatically looks up the values of variables.
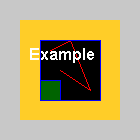
The example below shows how to extend the above DRAW block to create additional graphical shapes:
view layout [
    box black 100x100 effect [
        draw [
            pen red
            line 30x30 50x20 70x70 40x50

            pen blue
            box 20x20 80x80

            fill-pen 0.100.0
            box 20x60 40x80

            pen white
            text 8x25 "Example"

            fill-pen gold
            flood 2x2
        ]
    ]
]
Here the DRAW keywords are PEN, LINE, BOX, FILL-PEN, TEXT, and FLOOD. The variables RED, BLUE, WHITE, and GOLD are used to specify the colors. A list of all DRAW keywords is provided below. As for variables, you can define any variables that you require, including colors, positions, and sizes.
The resulting image is:
In the examples above, the words and values of the dialect were specified directly by the programmer. But, because DRAW uses a normal block, you can easily use other REBOL functions to create more complex DRAW combinations.
The example below creates a DRAW block with 100 random lines of random colors.
block: copy []

loop 100 [
    append block compose [
        pen (random 255.255.255)
        line (random 100x100) (random 100x100)
    ]
]

view layout [
    box black 100x100 effect reduce ['draw block]
]
A result like this will appear:
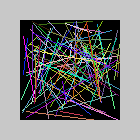
Note the use of the COMPOSE function to produce the words and values that are inserted into the DRAW block. Also, note the use of REDUCE to create an EFFECT block with the proper word and value. If you want to see the dialect code that is being produced, add a line like:
probe block
or, to see the entire EFFECT block:
box black 100x100 effect probe reduce ['draw block]
The PROBE function prints the value of the block and also returns it as the result.
Command Summary
The following commands can be used within the Draw dialect block. Each command can be followed by one or more optional attributes (described in more detail below).
| box | Draw a rectangle |
| circle | Draw a circle |
| fill-pen | Set the foreground and background fill colors |
| flood | Fill from a point outward |
| font | Specify text font attributes |
| image | Insert an image |
| line | Draw a line |
| line-pattern | Set the line pattern |
| pen | Set the foreground and background color |
| polygon | Draw a polygon |
| text | Draw text |
Color Summary
REBOL provides predefined words for a few common color values. These words are useful within the DRAW block. You can also define your own custom color words. For example:
dark-blue: 0.0.80
You can also use math operators to modify existing color values:
green / 2
silver - 20
coffee + 50
The REBOL predefined color words are:
| Name | Value | Color | Name | Value | Color | |
| aqua | 40.100.130 | base-color | 200.200.200 | |||
| beige | 255.228.196 | black | 0.0.0 | |||
| blue | 0.0.255 | brick | 178.34.34 | |||
| brown | 139.69.19 | coal | 64.64.64 | |||
| coffee | 76.26.0 | crimson | 220.20.60 | |||
| cyan | 0.255.255 | forest | 0.48.0 | |||
| gold | 255.205.40 | gray | 128.128.128 | |||
| green | 0.255.0 | ivory | 255.255.240 | |||
| khaki | 179.179.126 | leaf | 0.128.0 | |||
| linen | 250.240.230 | magenta | 255.0.255 | |||
| maroon | 128.0.0 | mint | 100.136.116 | |||
| navy | 0.0.128 | oldrab | 72.72.16 | |||
| olive | 128.128.0 | orange | 255.150.10 | |||
| papaya | 255.80.37 | pewter | 170.170.170 | |||
| pink | 255.164.200 | purple | 128.0.128 | |||
| reblue | 38.58.108 | rebolor | 142.128.110 | |||
| red | 255.0.0 | sienna | 160.82.45 | |||
| silver | 192.192.192 | sky | 164.200.255 | |||
| snow | 240.240.240 | tan | 222.184.135 | |||
| teal | 0.128.128 | violet | 72.0.90 | |||
| water | 80.108.142 | wheat | 245.222.129 | |||
| white | 255.255.255 | yellow | 255.255.0 |
Drawing Lines
The line command draws a line between two points. If more than two points are given multiple lines are drawn in a connected fashion (but, the end point is not connected to the first point. To do that, see the polygon command).
The syntax of the line command is:
line point1 point2 ... pointn
Example lines are:
line 10x10 40x40

line 10x10 20x50 30x0 4x40
The line will be drawn using the current pen color and line pattern.
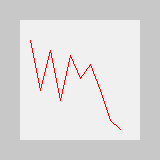
The example below plots data points from a data set:
data: [0 40 20 60 35 80 24 75 66 100]

plot: copy [pen black  line]

x: 10
foreach y data [
    append plot as-pair x 110 - y
    x: x + 10
]

view layout [
    box snow 120x120 effect reduce ['draw plot]
]
The subtraction from 110 is used to move the origin (0x0 point) to the lower left corner, making the graph look normal.
Adding a second graph to the image is easy to do by adding another pen and line. To make the example more interesting, we'll use decimal numbers that are scaled.
price: [0.9 0.4 0.8 0.3 0.75 0.52 0.66 0.4 0.1 0.01]

plot: copy [pen red  line]

x: 10
foreach y price [
    append plot as-pair x 110 - (to-integer 100 * y)
    x: x + 10
]

view layout [
    box snow 120x120 effect reduce ['draw plot]
]
The result is:
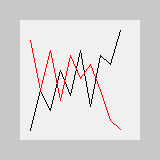
Combining the two plots onto a single graph:
data: [0 40 20 60 35 80 24 75 66 100]
plot: copy [pen black  line]
x: 10
foreach y data [
    append plot as-pair x 110 - y
    x: x + 10
]

price: [0.9 0.4 0.8 0.3 0.75 0.52 0.66 0.4 0.1 0.01]
append plot [pen red  line]
x: 10
foreach y price [
    append plot as-pair x 110 - (to-integer 100 * y)
    x: x + 10
]

view layout [
    box snow 120x120 effect reduce ['draw plot]
]
Produces:
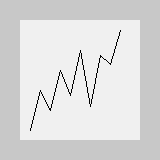
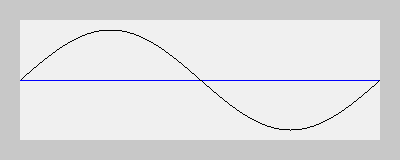
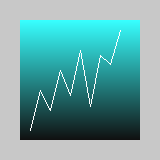
The example below uses the line command to plot a sine wave function:
plot: copy [
    pen blue
    line 0x60 360x60
    pen black
    line
]

repeat x 360 [
    append plot as-pair x 60 - (50 * sine x)
]

view layout [
    box snow 360x120 effect reduce ['draw plot]
]
The resulting image is:
Drawing Polygons
The polygon command is similar to the line command, except that the end point is connected back to the first point to close the polygon.
The syntax of the polygon command is:
polygon point1 point2 ... pointn
Example of using polygon in a draw block:
polygon 10x80 50x10 90x80
Putting this into a draw block:
view layout [
    box snow 100x100 effect [
        draw [
            pen black
            polygon 10x80 50x10 90x80
        ]
    ]
]
would produce:
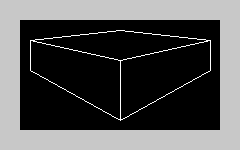
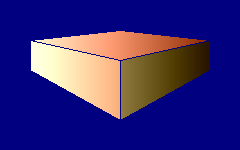
Multiple polygons can be joined to create a wide variety of shapes. For example these three polygons form the corner of a box:
plot: [
    pen white
    polygon 10x20 100x10 190x20 100x40
    polygon 10x20 100x40 100x100 10x50
    polygon 100x40 190x20 190x50 100x100
]

view layout [
    box black 200x110 effect reduce ['draw plot]
]
The above example renders this image:
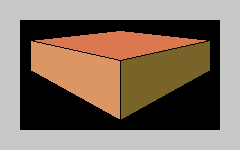
To create filled polygons, just add a fill-pen color before the polygon command. The example below shows three polygons with different colors:
plot: [
    fill-pen 220.120.80
    polygon 10x20 100x10 190x20 100x40
    fill-pen 220.150.100
    polygon 10x20 100x40 100x100 10x50
    fill-pen 120.100.40
    polygon 100x40 190x20 190x50 100x100
]

view layout [
    box black 200x110 effect reduce ['draw plot]
]
The image now appears as:
Drawing Rectangles
The BOX command provides a shortcut for a rectangular polygon. Only the upper left and lower right points are needed to draw the box.
The syntax is:
box point1 point2
For example:
box 20x20 80x80
Will draw a square that is 60 wide by 60 high.
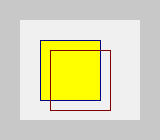
As with polygons, if you specify a fill-pen color, the box will be filled.
view layout [
    box snow 120x100 effect [
        draw [
            pen navy
            fill-pen yellow
            box 20x20 80x80
            fill-pen none
            pen maroon
            box 30x30 90x90
        ]
    ]
]
The result is:
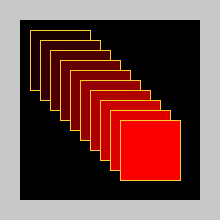
Here's an example that composes a sequence of boxes:
plot: copy []
xy: 10x10

repeat n 10 [
    append plot compose [
        pen gold
        fill-pen (n * 25.0.0)
        box (xy) (xy + 60)
    ]
    xy: xy + 10
]

view layout [
    box black 180x180 effect reduce ['draw plot]
]
The result is:
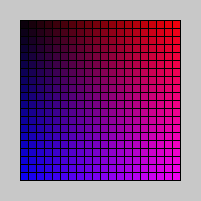
This example creates a color grid that mixes red and blue:
plot: copy []
color: 0.0.0

repeat x 20 [
    repeat y 20 [
        append plot compose [
            pen none
            fill-pen ((x * 12.0.0) + (y * 0.0.12))
            box (xy: 8 * as-pair x - 1 y - 1) (xy + 8)
        ]
    ]
]

view layout [
    box black 161x161 effect reduce ['draw plot]
]
It produces:
Drawing Circles
The CIRCLE command lets you draw a circle by providing its center point and radius.
The syntax is:
circle point radius
The radius must be an integer value. For example:
circle 50x50 40
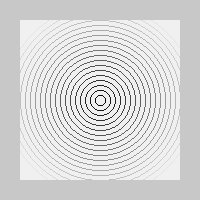
As with other drawing commands, you can set the pen color as shown in this example:
plot: copy []

repeat n 20 [
    append plot compose [
        pen (n * 12.12.12)
        circle 80x80 (n * 5)
    ]
]

view layout [
    box snow 160x160 effect reduce ['draw plot]
]
The result is a set of concentric circles:
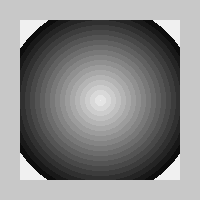
And, you can also set the fill color using the fill-pen command:
plot: copy []

repeat n 20 [
    append plot compose [
        pen (n * 12.12.12)
        fill-pen (n * 12.12.12)
        circle 80x80 (20 - n * 5)
    ]
]

view layout [
    box snow 160x160 effect reduce ['draw plot]
]
which results in:
Pen Attributes
The above sections have shown many examples that set the pen colors using the PEN and FILL-PEN commands. Here are more details about these attributes.
Pen
Sets the current foreground color and background color for outline rendering (line, circle, polygon, box). The Pen color will remain in effect until a new pen color is set.
The syntax is:
pen foreground-color background-color
Both colors must be a value that is a tuple or none. A none value is equivalent to transparent.
The default colors are:
foreground: inverse of the face color (face/color)
background: none
The background color is used when drawing line patterns.
Fill-Pen
Sets the current foreground color and background color for area filling (circle, box, flood, polygon). The FILL-PEN color will remain in effect until it is set to a new color or set to no color.
The syntax is:
fill-pen foreground-color background-color
Both colors must be a value that is a tuple or none. A none value is equivalent to transparent.
The default colors are set to none. The background color is not currently used.
Line-Pattern
Set the line pattern for all outlines (except circle). The line pattern will remain in effect until it is set to a new value or cleared (set to no value).
The syntax is:
line-pattern len1 len2 ... lenN
Up to eight optional parameters define the lengths of alternating on (foreground color) and off (background color) segments of the line. If no parameters are provided, the line pattern is reset to a solid line.
For example,
line-patten 1 5
defines a dotted line, with single dots that are five pixels apart.
The example:
line-pattern 8 8
defines a dashed line the code:
line-pattern 1 4 4 4
defines a morse-code-style line (alternating between dotted and dashed).
To disable line patterns:
line-pattern
no parameters are needed.
Example of the various line patterns shown above:
view layout [
    box snow 100x40 effect [
        draw [
            line-pattern 1 5
            line 10x10 90x10
            line-pattern 4 4
            line 10x20 90x20
            line-pattern 1 4 4 4
            line 10x30 90x30
        ]
    ]
]
Produces this image:
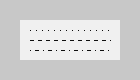
Note: In the process of writing this document we discovered a bug with background colors when used with the line-pattern. This bug will be fixed in a future version.
Flood Filling
A flood fill will fill the area around a given point with the current foreground fill color. The fill will spread in all directions until it hits any other color. Or, by providing a border color, the fill will be restricted only by pixels that have that color.
The syntax is:
flood point border-color
The point is the starting position for the flood. The border-color is an option color to stop the fill.
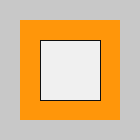
For example, this code fills the outside area of a box:
view layout [
    box snow 100x100 effect [
        draw [
            box 20x20 80x80
            fill-pen orange
            flood 2x2
        ]
    ]
]
It looks like:
The example below fills the area outside a random polygon:
plot: copy [pen black polygon]

loop 10 [append plot random 100x100]

append plot [fill-pen blue flood 2x2]

view layout [
    box snow 100x100 effect reduce ['draw plot]
]
and results in:
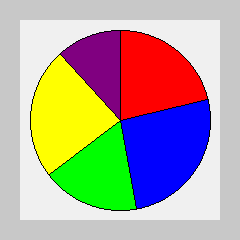
The example below uses flood fill along with the CIRCLE and LINE commands to create a pie chart.
data: [
    18 red
    22 blue
    15 green
    20 yellow
    10 purple
]

sum: 0
foreach [val color] data [sum: sum + val]

plot: copy [
    pen black
    circle 100x100 90
    line 100x100 100x10
]

total: 0
foreach [val color] data [
    angle: 360 * val / sum
    total: total + angle
    xy: 100x100 + as-pair 90 * sine total -90 * cosine total
    repend plot ['line 100x100 xy]
    append plot reduce [
        'fill-pen color
        'flood 100x100 +
            100x100 + (as-pair
                90 * sine total - (angle / 2)
                -90 * cosine total - (angle / 2)
            ) / 2
    ]
]

view layout [
    box snow 200x200 effect reduce ['draw plot]
]
The pie chart looks like:
Including Images
Although images are normally added to images by adding REBOL face objects, they can also be added with the draw effect.
The command syntax is:
image point image-data key-color
The point is the upper left location of the image. It is followed by an image datatype (usually the result of the LOAD function). The key color is used for specifying a color to use for transparent. The point and key-color are optional.
Example usage would be:
image 10x20 photo
where photo is a variable that holds an image loaded earlier with a line like:
photo: load %photo.jpg
If the photo required transparent pixels for blue, the DRAW command would become:
image 10x20 photo 0.0.255
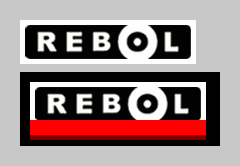
For example, the code:
img: load http://data.rebol.com/graphics/reb-logo.gif

view layout [
    image img
    box black 200x74 effect compose/deep [
        draw [
            image 10x10 (img)
            pen red
            fill-pen red
            box 10x48 185x63
            pen maroon
            fill-pen maroon
            box 10x63 185x67
        ]
    ]
]
loads the REBOL logo from the website and creates this image:
Drawing Text
Text can be added to images that are generated with the DRAW dialect. There are two ways to add text to images:
- Add transparent text faces on top of the image.
- Add text in the DRAW dialect.
The first method is more flexible and powerful, but the second is more efficient.
Text is added in the same way as all other DRAW commands. The syntax is:
text point text-string
The text-string will be rendered at the specified position, using the current font setting, and foreground and background colors. Here is an example:
text 5x10 "Graphics Plot"
The default font is the one specified by the face in which the draw is being done. You can modify the text font settings with the command:
font object
The object is the FONT object that is normally included as part of the FACE object.
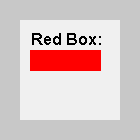
Example:
view layout [
    box snow 100x100 effect [
        draw [
            pen red
            fill-pen red
            box 10x30 80x50
            pen black
            text 10x10 "Red Box:"
        ]
    ]
]
Result:
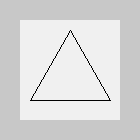
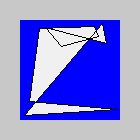
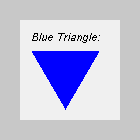
This example modifies the font object:
font-obj: make face/font [
    size: 11
    style: [italic]
]

view layout [
    box snow 100x100 effect compose/deep [
        draw [
            pen gray
            fill-pen blue
            polygon 10x30 80x30 45x90
            font (font-obj)
            pen black
            text 10x10 "Blue Triangle:"
        ]
    ]
]
Result:
Combined Effects
The DRAW effect can be combined with other FACE effects. The additional effects can be put before or after the DRAW.
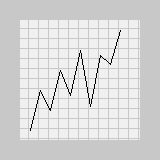
For example, the code below insert a GRID effect before the DRAW:
data: [0 40 20 60 35 80 24 75 66 100]
plot: copy [pen black  line]
x: 10
foreach y data [
    append plot as-pair x 110 - y
    x: x + 10
]

view layout [
    box snow 120x120 effect reduce [
        'grid 10x10 200.200.200
        'draw plot
    ]
]
It looks like:
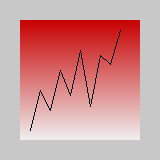
Any effect could be used. For example:
view layout [
    box snow 120x120 effect reduce [
        'gradient 0x1 200.0.0
        'draw plot
    ]
]
produces:
Other effects can also follow the DRAW block. For example, the code below follows the plot with an INVERT effect:
view layout [
    box snow 120x120 effect reduce [
        'gradient 0x1 200.0.0
        'draw plot
        'invert
    ]
]
that results in:
The example below applies a gradient shading to the results of the DRAW:
plot: [
    fill-pen 220.120.80
    polygon 10x20 100x10 190x20 100x40
    fill-pen 220.150.100
    polygon 10x20 100x40 100x100 10x50
    fill-pen 120.100.40
    polygon 100x40 190x20 190x50 100x100
]

view layout [
    backdrop navy
    box 200x110 effect reduce [
        'draw plot
        'gradmul 200.200.200 80.80.80
    ]
]
and the output image becomes:
World's Smallest Draw Program
In the example below the DRAW dialect is used to create what may be the world's smallest draw program. The program is less than 2 pages of code, yet it includes features such as multiple levels of undo and redo. This program was written by Frank Sievertsen and can be found in the REBOL library. We've added a few extra buttons to provide clear, save, and load capabilities.
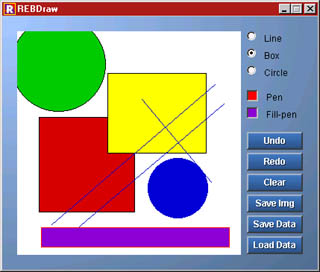
The program is useful because it can save and load the DRAW dialect block to a file where you can look at it with a text editor. Note that the word rebdraw at the top of the data files is just there to keep users from accidentally loading the wrong type of file.
REBOL []

color: fill-color: start: draw-image: draw-pos: tmp: none
type: 'box
undos: []
redos: []

draw: func [offset /local tmp] [
    compose [
        pen (color/color)
        fill-pen (fill-color/color)
        (type) (start) (either type = 'circle [
            tmp: offset - start
            to-integer square-root add tmp/x ** 2 tmp/y ** 2
        ] [offset])
    ]
]

lay: layout [
    style button button 75
    space 8x4
    backdrop effect compose [gradient 1x1 (sky) (water)]
    across
    draw-image: image white 300x300 effect [draw []]
    feel [
        engage: func [face action event] [
            if all [type start] [
                if find [over away] action [
                    append clear draw-pos draw event/offset
                    show face
                ]
                if action = 'up [
                    append/only undos draw-pos
                    draw-pos: tail draw-pos
                    start: none
                ]
            ]
            if all [type action = 'down] [
                start: event/offset
            ]
        ]
    ]
    do [draw-pos: draw-image/effect/draw]
    guide
    style text text [
        tmp: first back find face/parent-face/pane face
        tmp/feel/engage tmp 'down none
        tmp/feel/engage tmp 'up none
    ]
    radio [type: 'line] text "Line"
    return
    radio [type: 'box] on text "Box"
    return
    radio [type: 'circle] text "Circle"
    return
    pad 0x10
    style color-box box 15x15 [
        face/color: either face/color
            [request-color/color face/color] [request-color]
    ] ibevel
    color: color-box 0.0.0 text "Pen"
    return
    fill-color: color-box text "Fill-pen"
    return
    pad 0x10
    button "Undo" #"^Z" [
        if not empty? undos [
            append/only redos copy last undos
            draw-pos: clear last undos
            remove back tail undos
            show draw-image
        ]
    ]
    return
    button "Redo" #"^Y" [
        if not empty? redos [
            append/only undos draw-pos
            draw-pos: insert draw-pos last redos
            remove back tail redos
            show draw-image
        ]
    ]
    return
    button "Clear" [
        if not confirm "Clear image?" [exit]
        clear draw-pos: head draw-pos
        undos: copy [] redos: copy []
        show draw-image
    ]
    return
    button "Save Img" [
        if not file: request-file/save/only [exit]
        if not find file ".png" [append file ".png"]
        save/png file to-image draw-image
    ]
    return
    button "Save Data" #"^S" [
        if not file: request-file/save/only [exit]
        save file head insert head draw-pos 'rebdraw
    ]
    return
    button "Load Data" [
        if any [
            not file: request-file/save/only
            error? try [value: copy find/tail load file 'rebdraw]
        ][exit]
        draw-pos: insert tail draw-pos value
        show draw-image
    ]
]

view/title lay "REBDraw"
Known Problems
The following list are known problems with the current DRAW dialect:
- Polygon Edge Colors
Polygons lose their edge colors when a FILL-PEN is specified. - Polygon Outside Face
In some cases, if your polygon extends outside the bounding face, it may crash while rendering the draw.
Cycling Colored Boxes
Carl Read submitted this example that is a variation on the "10 boxes" example shown in the Drawing Rectangles section above.
His change adds a RATE event and an Engage function (event handler) that modifies the colors of the boxes to create an animated effect. The cycling colors are done by simply moving the index to a block containing the color values.
plot: copy []
colors: copy []

xy: 10x10

repeat n 10 [
    append colors n * 25.0.0
    append plot compose [
        pen gold
        fill-pen pick colors (n)
        box (xy) (xy + 60)
    ]
    xy: xy + 10
]
append colors head reverse copy colors

view layout [
    boxes: box black 180x180 effect reduce ['draw plot]
        rate 25 feel [
            engage: [
                colors: next colors
                show boxes
                if 10 = length? colors [colors: head colors]
            ]
        ]
]